

Olympia:
(360) 489-1804
Sequim:
(360) 477-4507
Olympia:
(360) 489-1804
Sequim:
(360) 477-4507
Gold and silver have been valued for centuries as precious metals, stores of value, collectible materials, and forms of money. Because their prices move independently, investors and collectors often compare them using the gold silver ratio.
The gold silver ratio shows how many ounces of silver are equal in value to one ounce of gold. It can help put current precious-metal prices into perspective, but it is best understood as a comparison tool rather than a prediction of where either metal will go next.
This guide explains what the gold silver ratio is, how to calculate it, what a high or low ratio means, how today's ratio compares with historical conditions, and how buyers and sellers of physical gold and silver can use the information.
The gold silver ratio, sometimes called the gold and silver ratio, compares the market price of one troy ounce of gold with the market price of one troy ounce of silver.
A troy ounce is the standard unit of weight commonly used for precious metals. One troy ounce is slightly heavier than the everyday ounce commonly used to measure food and other household items.
The ratio answers a simple question:
How many ounces of silver would have approximately the same metal value as one ounce of gold?
The calculation is:
Gold price per troy ounce ÷ Silver price per troy ounce = Gold silver ratio
For example, imagine gold is trading at $3,000 per troy ounce and silver is trading at $30 per troy ounce.
$3,000 ÷ $30 = 100
The resulting gold silver ratio would be 100:1.
That means one ounce of gold would have approximately the same spot-market value as 100 ounces of silver.
The calculation itself is simple, but interpreting the result requires understanding how the prices of the two metals move.
The ratio does not tell you whether gold or silver is expensive in absolute dollar terms. Instead, it compares the two metals with each other.
For example, gold and silver could both increase in price while the gold silver ratio falls. That would happen if silver increased more rapidly than gold.
Likewise, both metals could decline while the ratio rises if silver loses value more quickly than gold.
For that reason, comparing the price of gold vs price of silver provides different information than simply looking at each metal's dollar price.

Understanding what the gold silver ratio means is more useful than simply knowing the number.
The ratio measures the relative price relationship between the two metals.
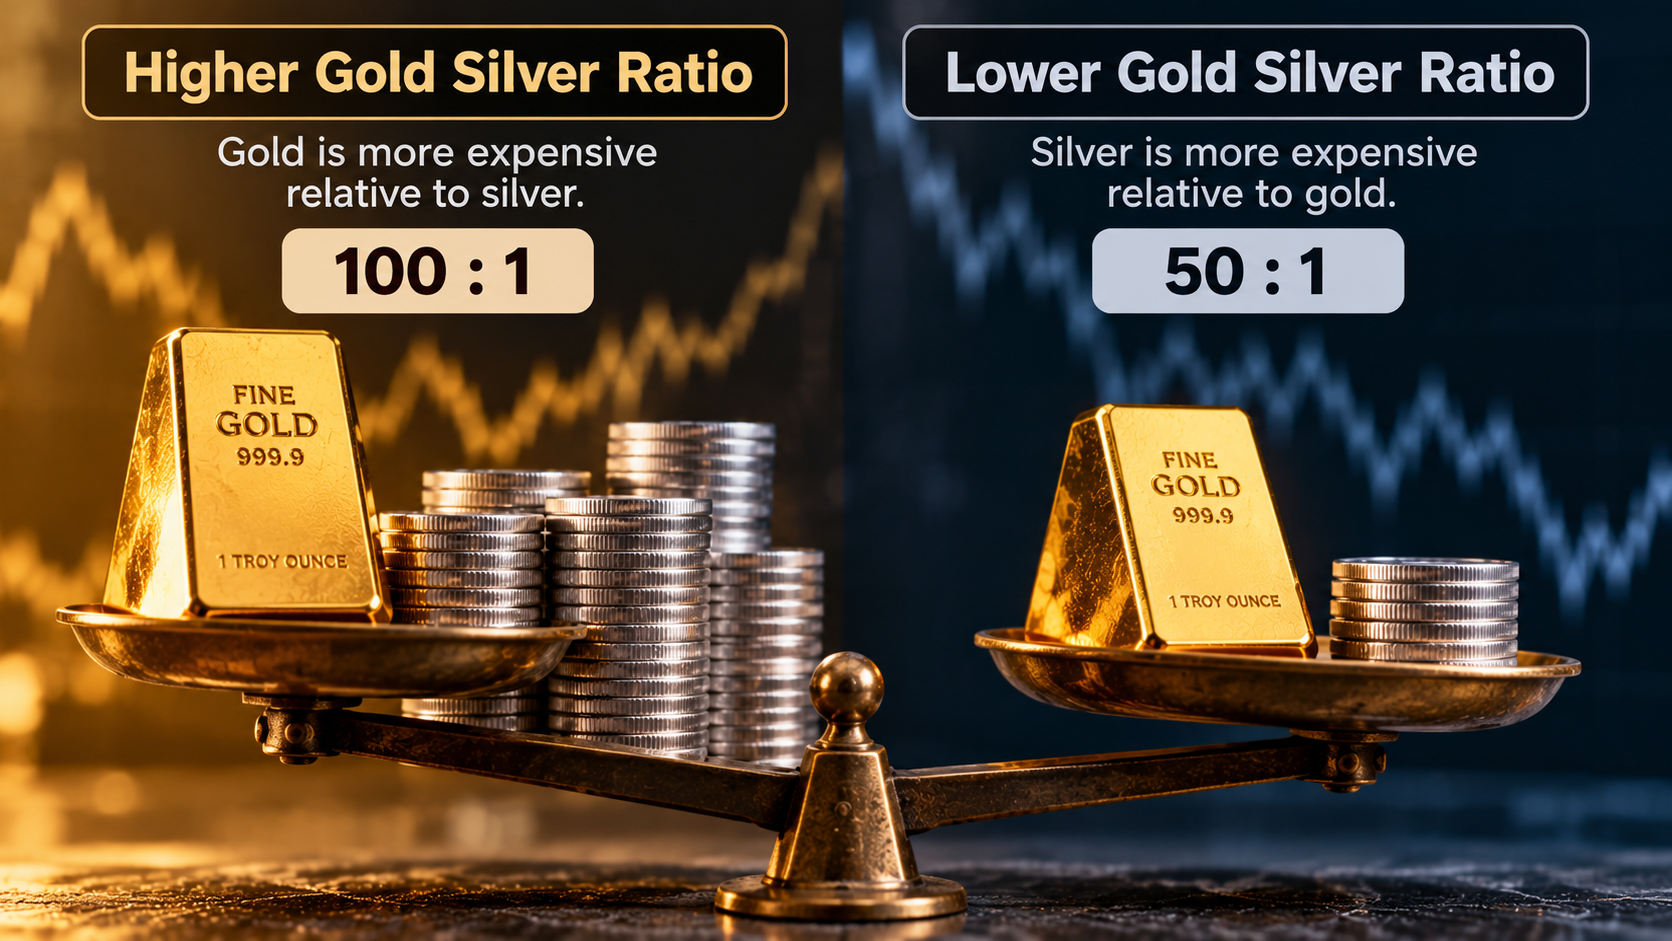
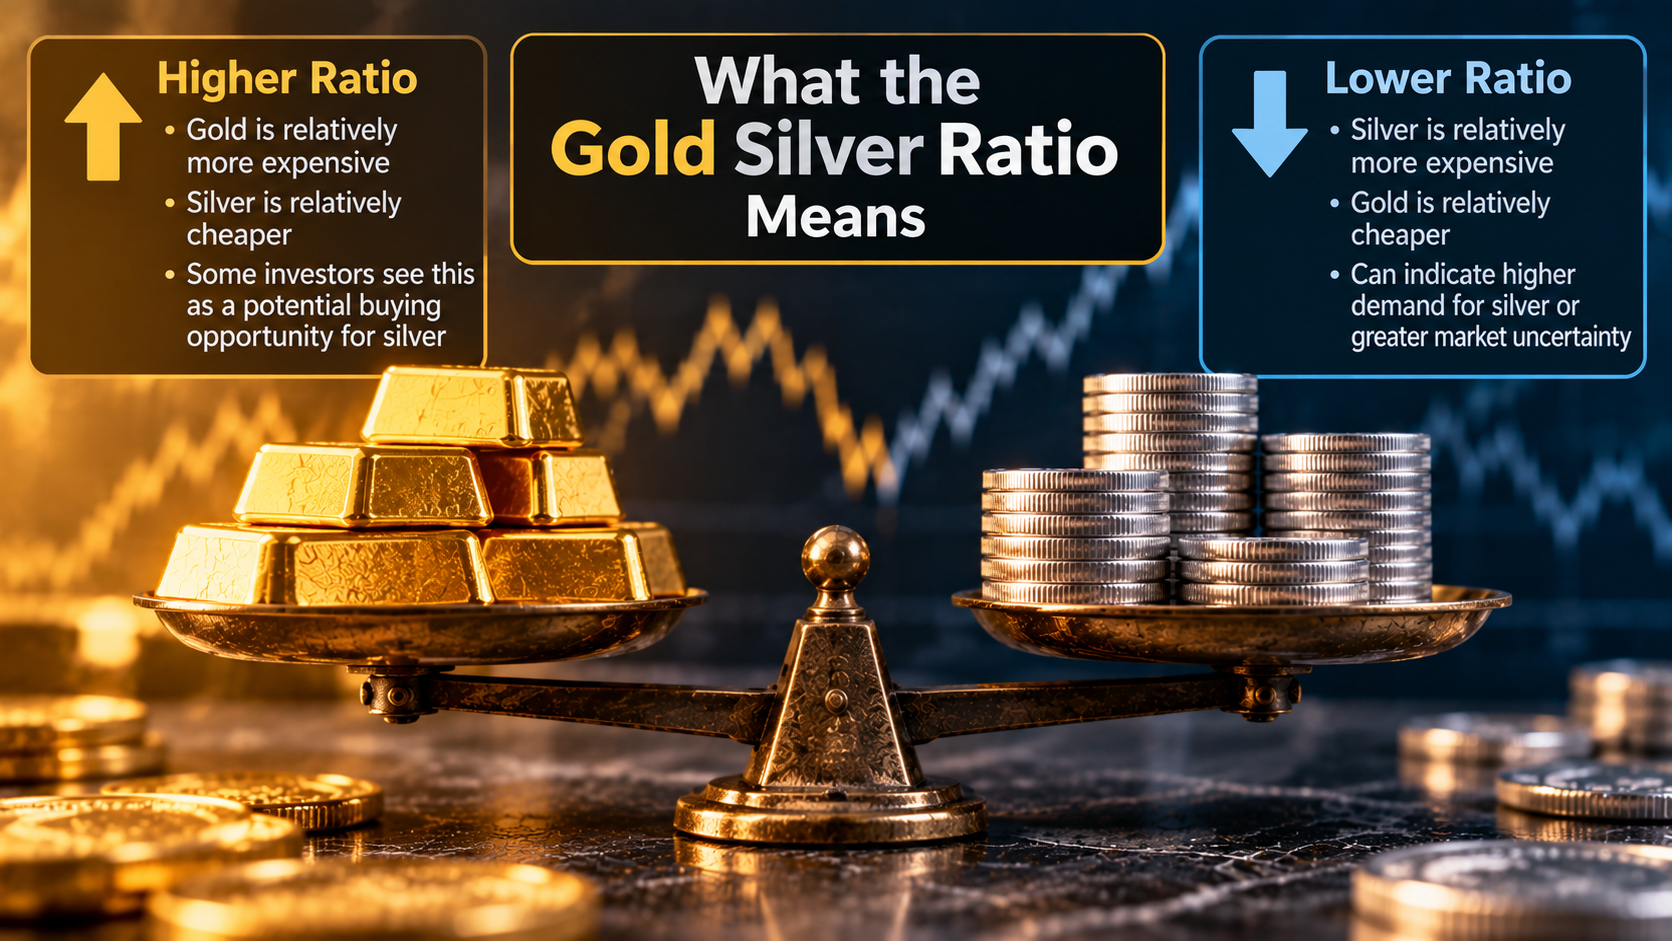
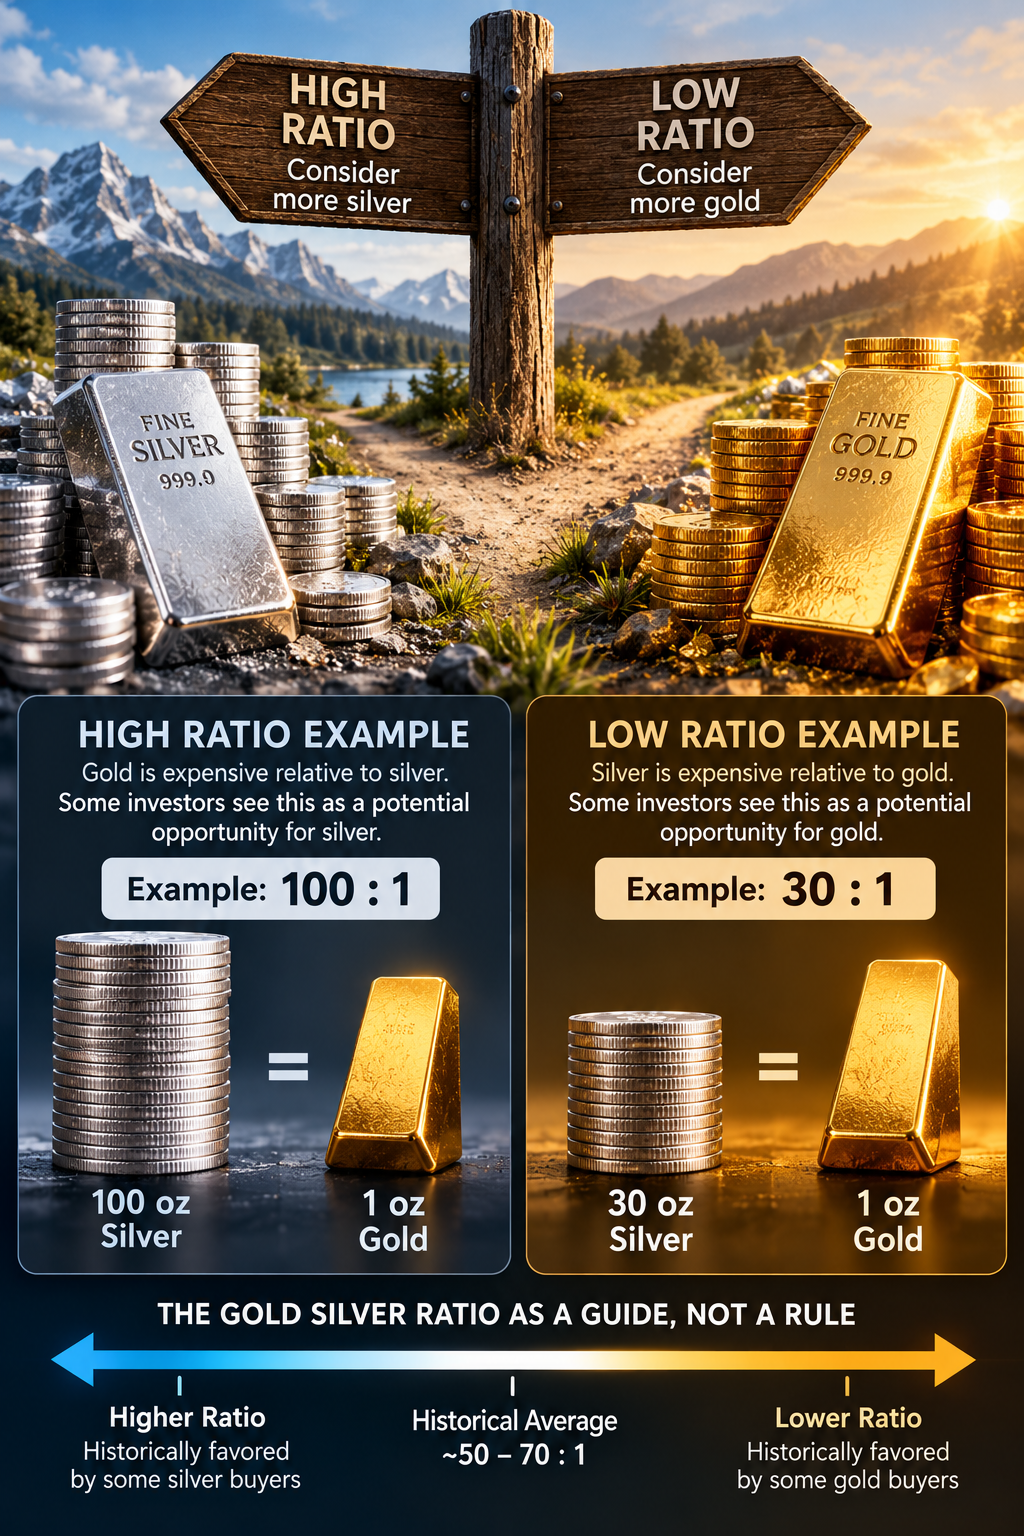
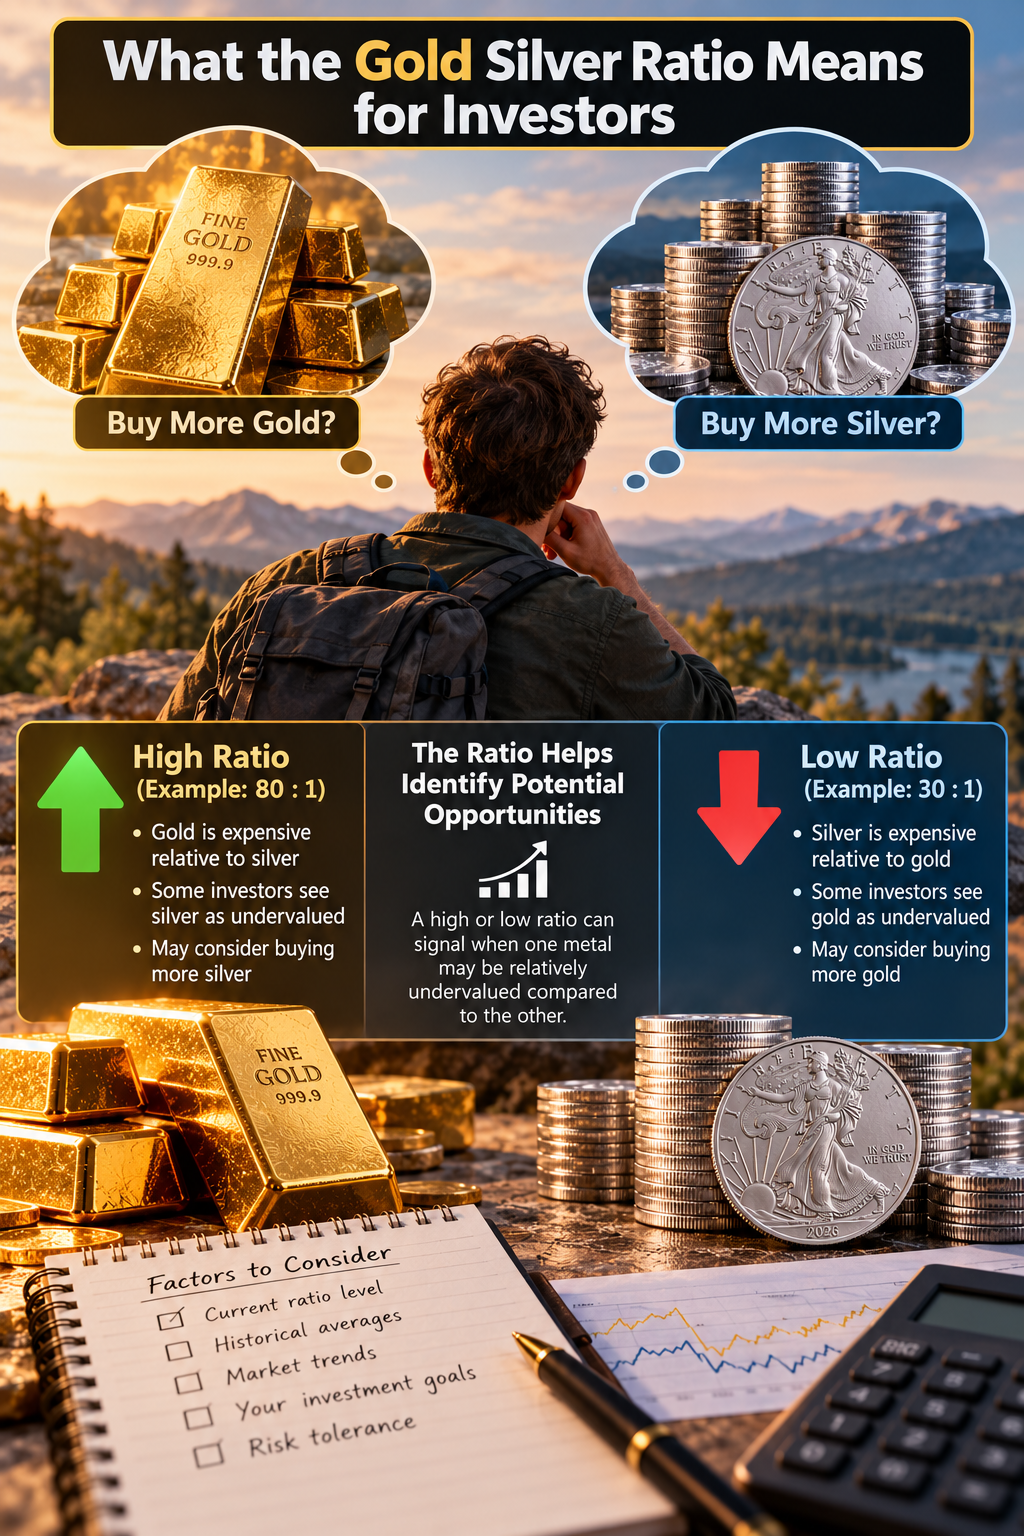
A higher ratio means gold is more expensive relative to silver.
For example, a ratio of 100:1 means it takes 100 ounces of silver to equal the metal value of one ounce of gold.
If the ratio rises from 70:1 to 100:1, gold has become more valuable relative to silver during that period. This can happen because:
A high ratio does not automatically mean silver is "cheap" or that its price must rise. Relative-value relationships can remain elevated for extended periods.
A lower ratio means silver is more valuable relative to gold.
If the ratio falls from 90:1 to 60:1, fewer ounces of silver are required to equal the value of an ounce of gold.
Again, this does not necessarily mean gold is inexpensive or that silver is overpriced. The ratio only describes the relationship between the two prices.
This distinction is important when using the ratio to evaluate a gold vs silver investment decision. The ratio can provide context, but it cannot determine whether either metal is objectively undervalued or overvalued.
Because gold and silver trade continuously in global markets, the gold silver ratio today can change throughout the trading day.
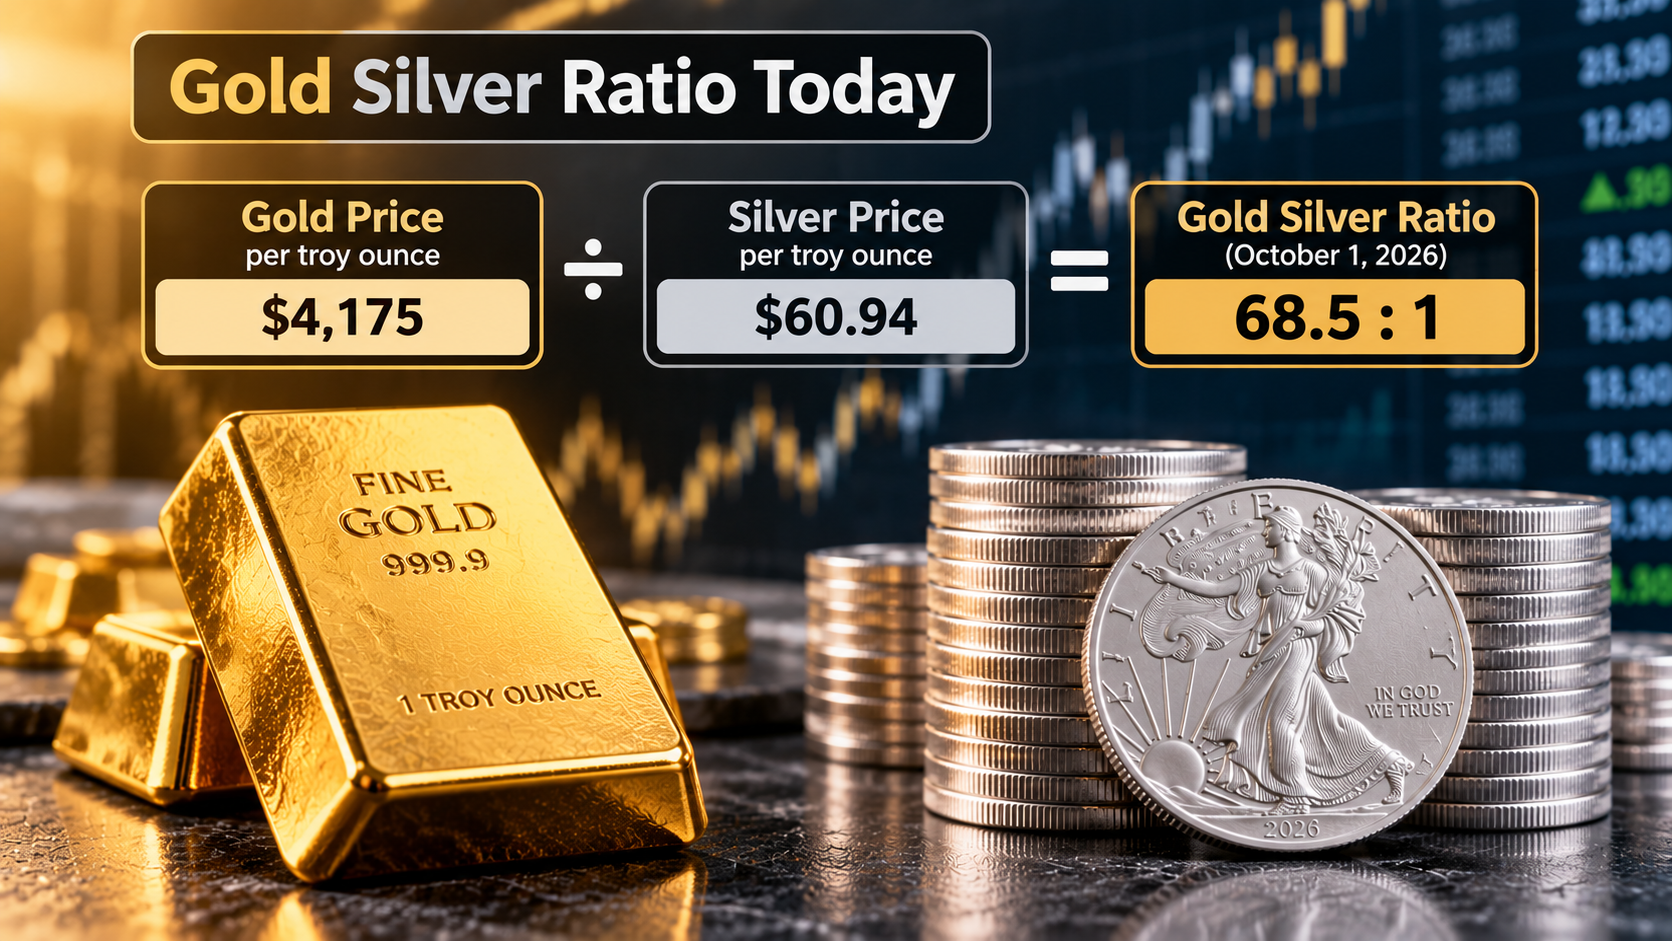
As a dated example, using spot gold of approximately $4,175 per troy ounce and spot silver of approximately $60.94 per troy ounce on October 1, 2026:
$4,175 ÷ $60.94 ≈ 68.5
That produces a gold silver ratio of approximately:
68.5:1
In other words, at those example prices, roughly 68.5 ounces of silver had the same spot-metal value as one ounce of gold.
This figure should not be treated as a live quote. Gold and silver spot prices change constantly, so anyone evaluating a purchase or sale should recalculate the current gold silver ratio using current market prices.
To calculate the ratio yourself:
For example:
Gold spot price ÷ Silver spot price = Current ratio
This makes the ratio easy to update whenever market prices change.
Gold and silver are separate commodities with different sources of demand, supply conditions, market participants, and economic uses.
Because their prices do not move in perfect synchronization, the ratio constantly changes.
A strong move in silver can push the ratio lower even if gold is rising at the same time. Conversely, strong demand for gold can push the ratio higher even if silver prices remain relatively stable.
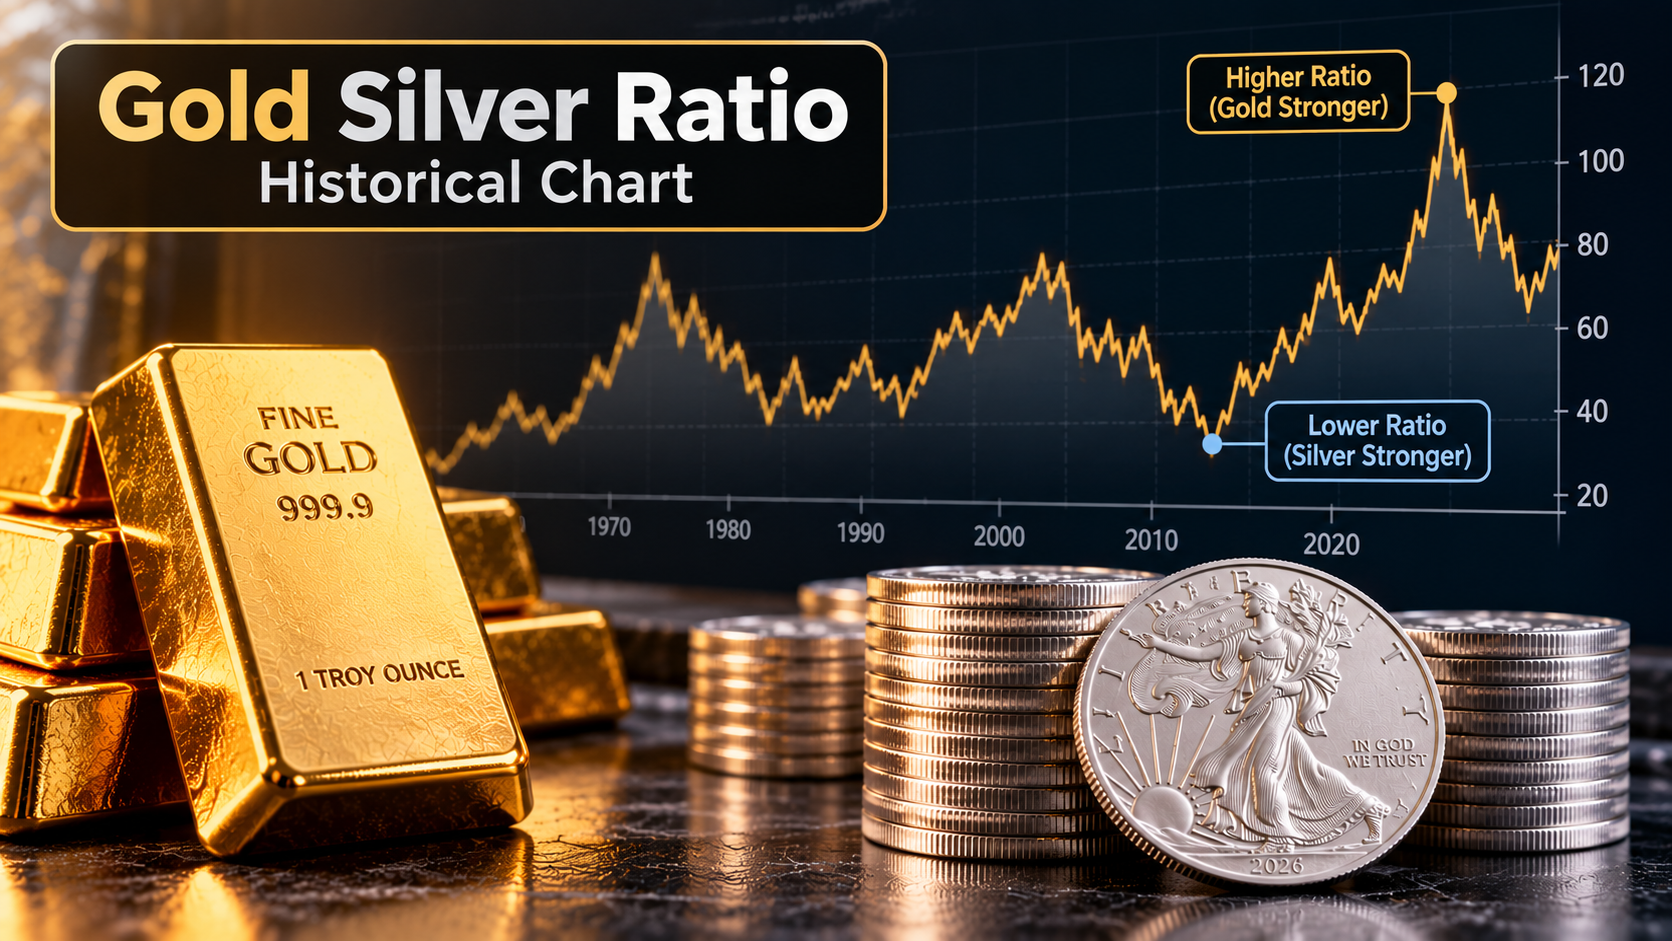
A single ratio provides only a snapshot.
A gold silver ratio chart can provide much more context by showing how the relationship between gold and silver has changed over months, years, or decades.
Rather than simply asking whether today's ratio is high or low, a chart allows you to see how today's level compares with previous market environments.
When reviewing a gold and silver ratio chart, look for several patterns.
Long-term trends:
Has the ratio generally been moving upward, downward, or sideways?
Sharp movements:
Sudden increases or declines can indicate that one metal is moving much faster than the other.
Periods of gold outperformance:
When the ratio rises, gold is generally gaining value relative to silver.
Periods of silver outperformance:
When the ratio falls, silver is generally gaining value relative to gold.
It can also be helpful to compare the ratio chart with separate gold and silver price charts. That shows whether a change in the ratio resulted from one metal rising, one falling, or both moving at different speeds.
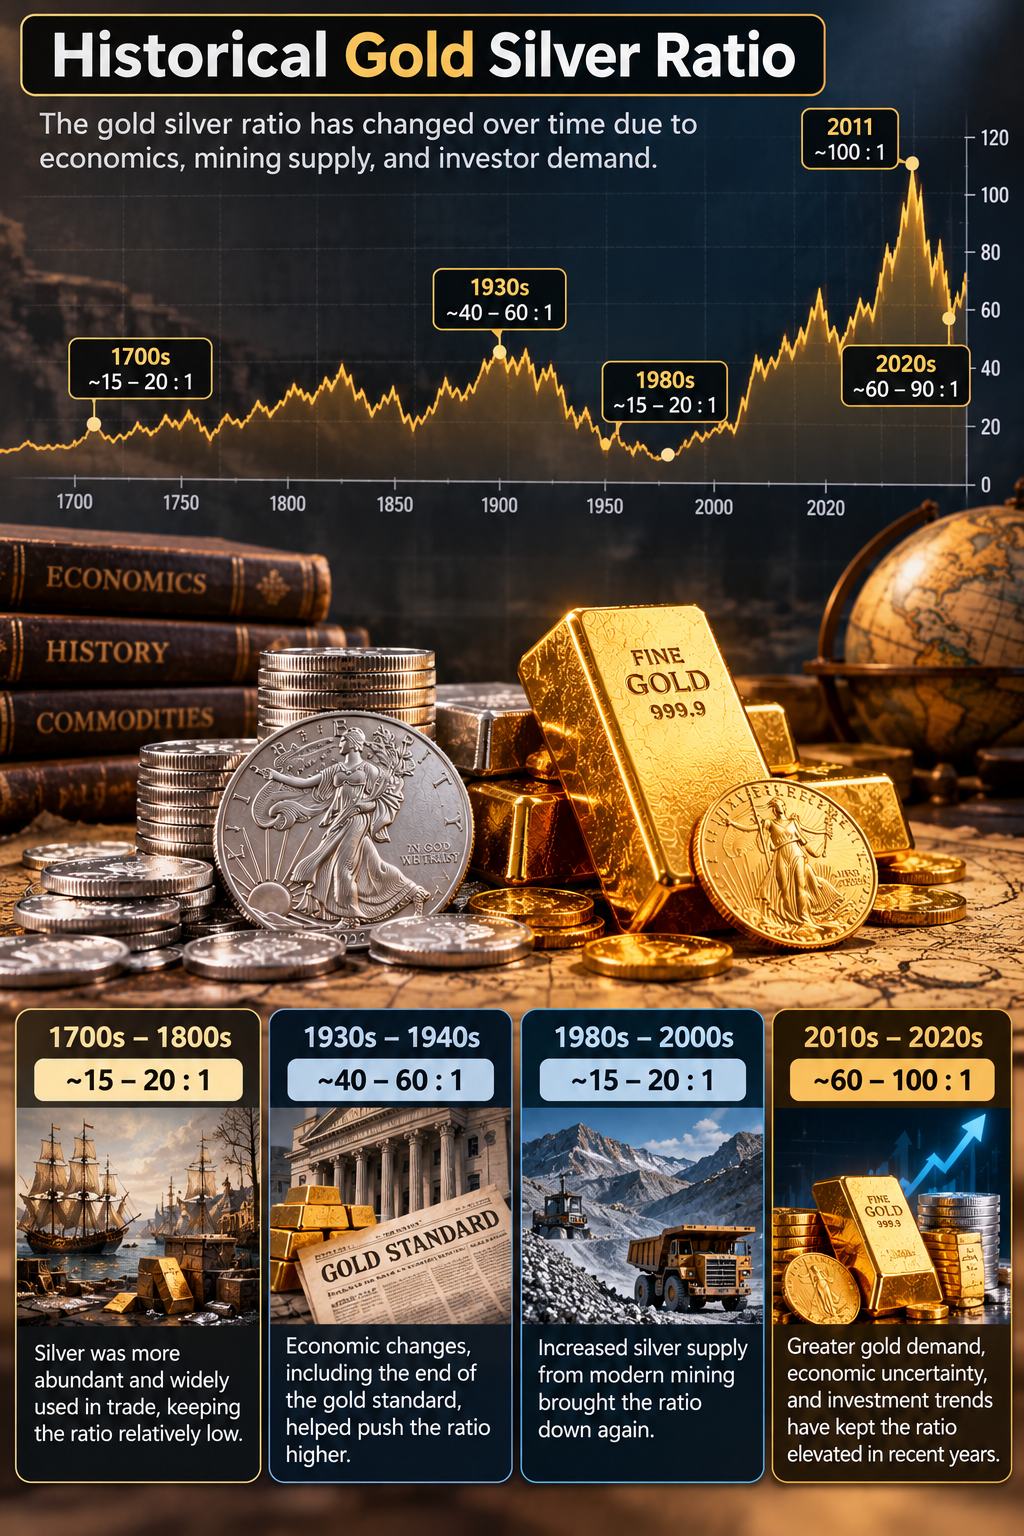
The historical gold silver ratio has not remained fixed.
The relationship between the two metals has changed considerably depending on monetary systems, economic conditions, industrial demand, investment demand, and market prices.
In some historical monetary systems, governments established official relationships between gold and silver.
Under a bimetallic monetary system, both metals could serve monetary roles, and governments sometimes established legal conversion relationships between them.
Those historical ratios were influenced by monetary policy rather than purely by freely changing market prices.
This makes direct comparisons between old government-established ratios and today's market-driven ratio potentially misleading.
Modern gold and silver prices are largely determined through global markets rather than a government permanently fixing one metal's value relative to the other.
As a result, the ratio can move substantially.
Gold and silver respond differently to factors such as investment demand, industrial demand, currency movements, interest-rate expectations, economic uncertainty, mining production, and broader commodity-market conditions.
For this reason, there is no single ratio that the market is required to return to.
Looking at historical highs and lows can help provide context, but historical averages should not be treated as guaranteed targets.
A ratio can remain above or below a historical average for a long time because the underlying gold and silver markets themselves change.
Industrial uses for silver, investment products, mining technology, monetary systems, and global demand have all changed over time.
Historical data is therefore best used to understand market behavior rather than to assume that a particular ratio must eventually repeat.
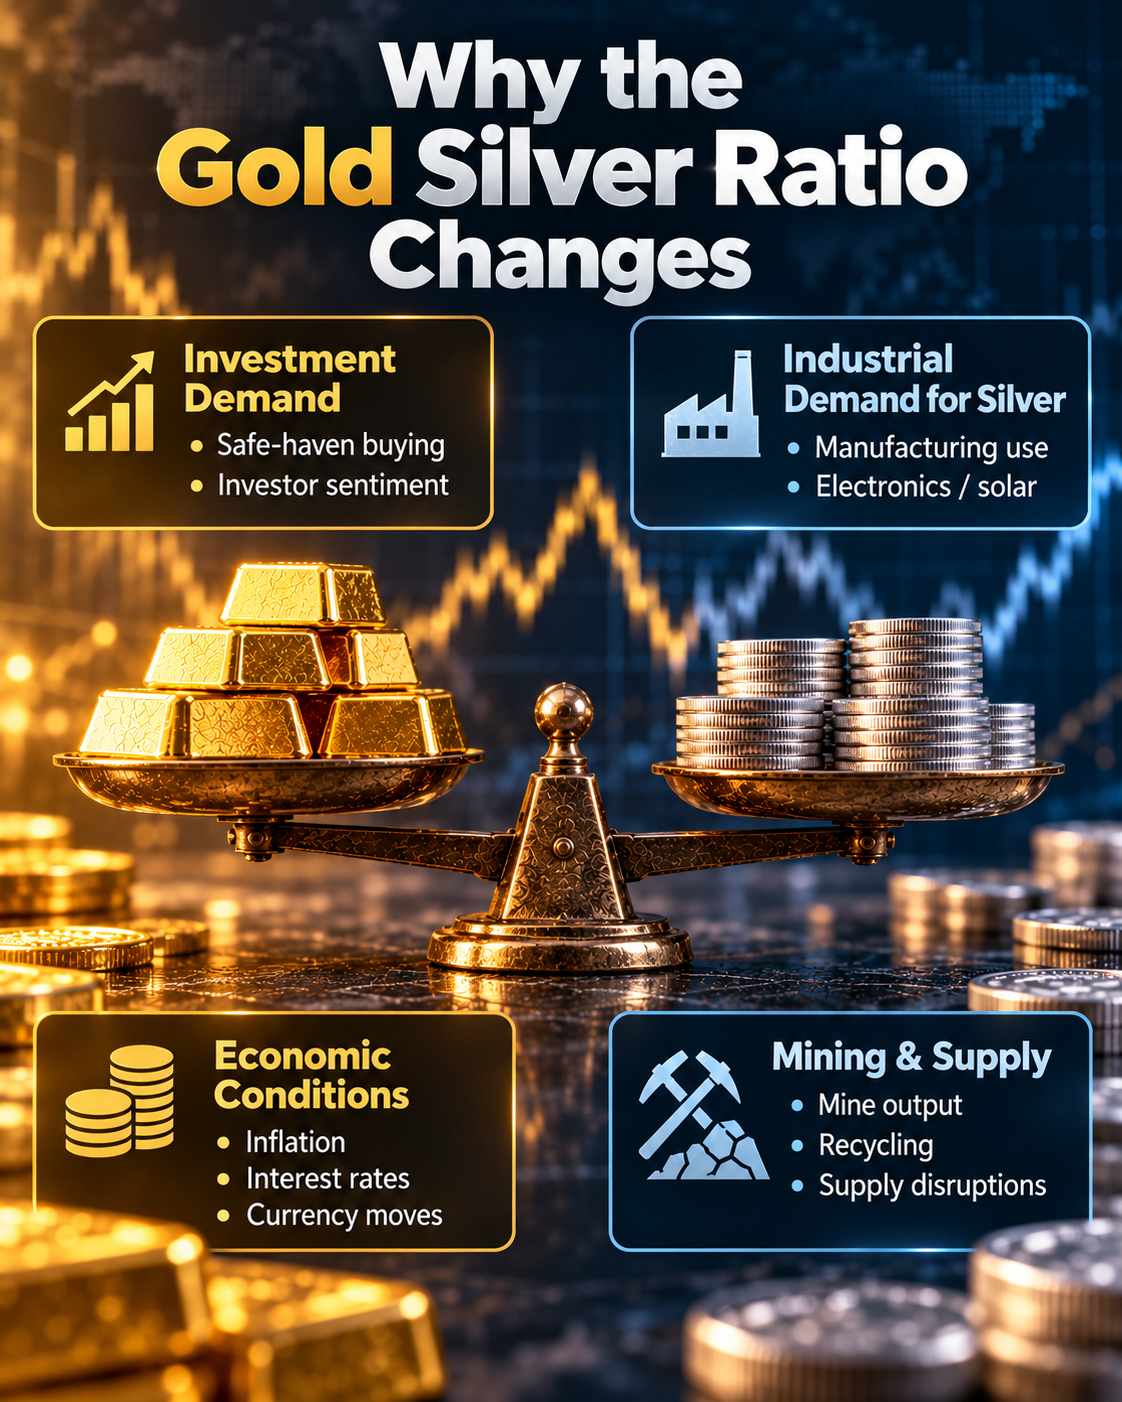
Several factors can cause gold and silver prices to move differently.
Both gold and silver are purchased by investors, collectors, institutions, and people who want exposure to precious metals.
Demand can rise during periods when investors are concerned about inflation, currencies, economic conditions, or financial-market uncertainty.
However, investors do not necessarily respond to gold and silver in exactly the same way.
Gold has a particularly prominent role as a monetary and investment asset, while silver combines investment demand with substantial industrial demand.
Silver is used in numerous industrial applications because of physical properties such as its electrical and thermal conductivity.
This means changes in manufacturing and industrial activity can affect silver differently from gold.
As a result, silver may sometimes behave partly like a precious metal and partly like an industrial commodity.
That difference is one reason the gold and silver ratio can move significantly even when both metals are responding to the same broader economic environment.
Economic conditions can affect demand for both metals.
Factors market participants commonly monitor include:
These factors interact rather than operating independently, so movements in the ratio usually cannot be attributed to a single cause.
Gold and silver also have different supply dynamics.
Mine production, recycling, production costs, new discoveries, and disruptions can influence how much metal reaches the market.
Silver is also sometimes produced alongside other metals rather than exclusively from primary silver mines. This means its supply can be influenced by mining activity in other commodity markets.
Differences in supply and demand help explain why gold and silver prices do not move together perfectly.
People comparing a gold vs silver investment sometimes use the ratio to evaluate which metal appears relatively expensive compared with the other.
The ratio can be useful, but it should be viewed as one piece of information rather than a complete investment strategy.
Suppose the ratio rises substantially.
An investor might interpret that as gold becoming increasingly expensive relative to silver.
If the ratio falls substantially, the investor might view silver as becoming more expensive relative to gold.
This can help investors decide which questions to investigate further.
However, the ratio alone does not tell an investor whether prices will reverse direction.
Some precious-metal investors attempt to increase their total metal holdings by exchanging gold for silver when the ratio is high and silver for gold when the ratio is low.
The idea is based on relative value rather than predicting the dollar price of either metal.
For example, if an investor can exchange one ounce of gold for a large quantity of silver and the ratio later falls, those silver holdings may theoretically exchange back into a greater quantity of gold.
In practice, however, physical-metal transactions involve additional costs.
Several practical factors can affect a ratio-based strategy.
These include:
For these reasons, the theoretical spot-market ratio and the ratio available through actual physical-metal trades may not be identical.
The gold silver ratio usually uses spot prices.
Spot price refers to the current market price of the underlying precious metal. However, physical coins and bullion generally do not trade at exactly the spot price.
A premium is the amount a buyer pays above the underlying metal's spot value.
For example, a silver coin may contain a certain amount of silver, but its retail price may be higher than the metal value alone.
Premiums can reflect factors such as:
Different gold and silver products can have very different premiums.
This means a 70:1 spot-market ratio does not necessarily mean someone could walk into a dealer and exchange exactly 70 ounces of physical silver for one ounce of physical gold.
When selling precious metals, the amount a dealer offers may also differ from the quoted spot price.
A spread is the difference between the price at which a dealer sells an item and the price at which the dealer is willing to buy it.
The spread varies depending on the product and market conditions.
For common bullion products, much of the value may come from precious-metal content. For collectible coins, additional factors such as rarity, condition, mint, date, and collector demand may matter considerably.
Because of these differences, the gold silver ratio is most useful as a market comparison rather than a precise exchange rate for physical coins or bullion.
Yes, provided it is used for the right purpose.
The ratio is particularly useful for comparing gold and silver with each other.
It can help someone:
The ratio is less useful when treated as a guaranteed trading signal.
There is no rule requiring the ratio to return to a particular historical number. Economic conditions and the markets for both metals can change.
Someone researching precious metals should therefore consider the ratio alongside current prices, market conditions, physical premiums, investment goals, and the characteristics of the individual products involved.
The gold silver ratio is one of the simplest ways to compare two of the world's most closely watched precious metals.
The calculation is straightforward:
Gold price per ounce ÷ Silver price per ounce = Gold silver ratio
A higher ratio means gold is more valuable relative to silver. A lower ratio means silver is more valuable relative to gold.
However, the ratio does not automatically tell you whether either metal is cheap, expensive, or about to change direction.
The most useful approach is to combine the current gold silver ratio with historical context, current spot prices, and an understanding of the physical products being bought or sold.
For owners of coins, bullion, jewelry, or other precious-metal items, the spot ratio is only part of the valuation process. Metal purity, weight, coin type, rarity, condition, premiums, and current dealer demand can all affect what an item is worth in the real world.
If you are in the Olympia area and want to better understand the value of physical gold, silver, coins, or bullion, American Rare Coin & Gold can evaluate individual items and explain how current precious-metal prices relate to their market value.
Whether you are collecting, buying, selling, or simply following the precious-metals market, understanding the gold silver ratio provides a useful framework for seeing how gold and silver are valued relative to one another.